“We have no time to improve” is something we hear regularly. Our knee jerk response is the old dutch proverb:
You don’t have time, you make time.
In our experience, improvements pay off faster than people believe, so it is worth making time to improve. See how we use flow distribution to make this visible.
A vicious cycle
This is easier said than done. Where do you find the time, and how do you exploit the time you found as a team?
We talk to many teams in large organizations. When we ask them about what share of their time they spend on fixing defects, this is more often than not 50%. Because the defect work is taking such a large share of their team, the teams can get little work with customer value (‘feature work’) done, which increases the pressure on the team.
Often, these teams feel so much pressure that they do not feel they have time for any improvements, however promising these might seem. For instance adding automated tests, making builds more stable, or even something as basic as simplifying build scripts so that all developers can add tests or split files.
These teams seem to be caught in a vicious cycle that becomes worse over time, as defects tend to increase when improvements are left out. Why is this?
These improvements are often understood to only have a noticeable effect on the medium to long term, which makes it hard to set aside time for these. Investing in improvements would have a devastating effect on the amount the feature work the team could get done. Or has it?
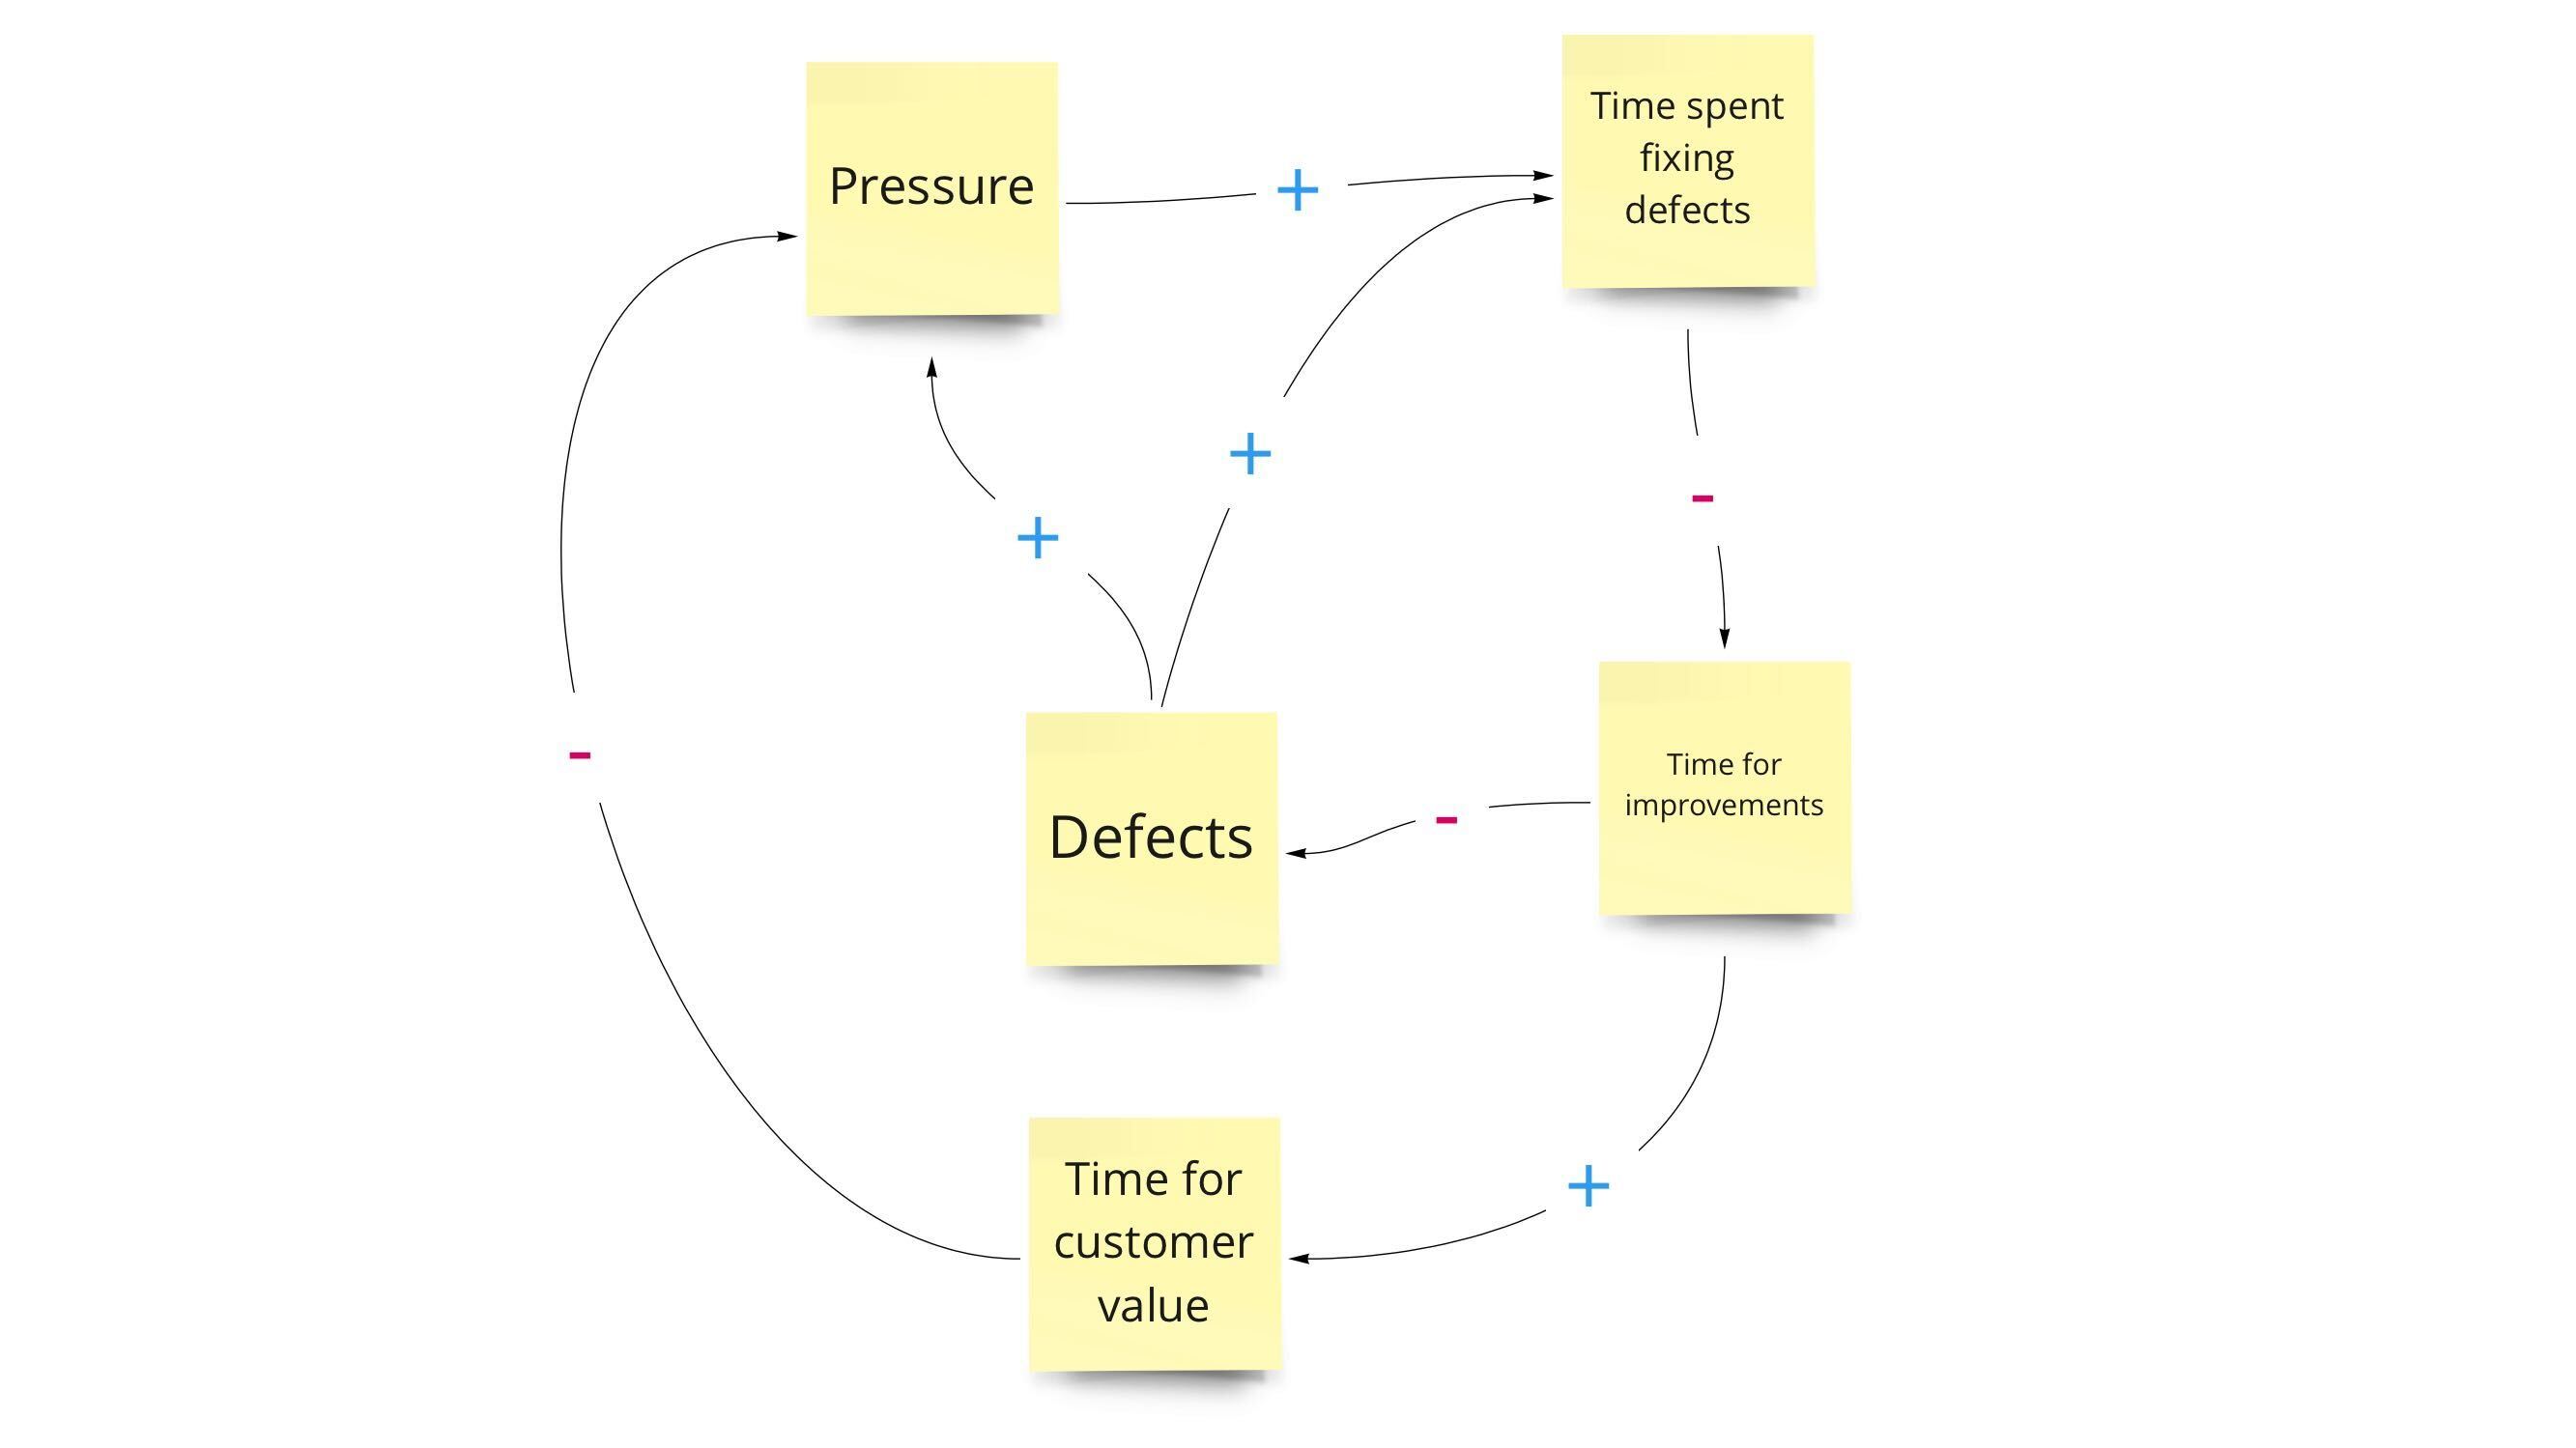 A vicious cycle - less time for improvements leads to more defects.
This cycle can also turn virtuous - if we make time for improvements, we can reduce the number of defects, and increase the time available for customer value. Lets’ see how to do that with a flow distribution as visualization aid.
Getting insight in your work: flow distribution
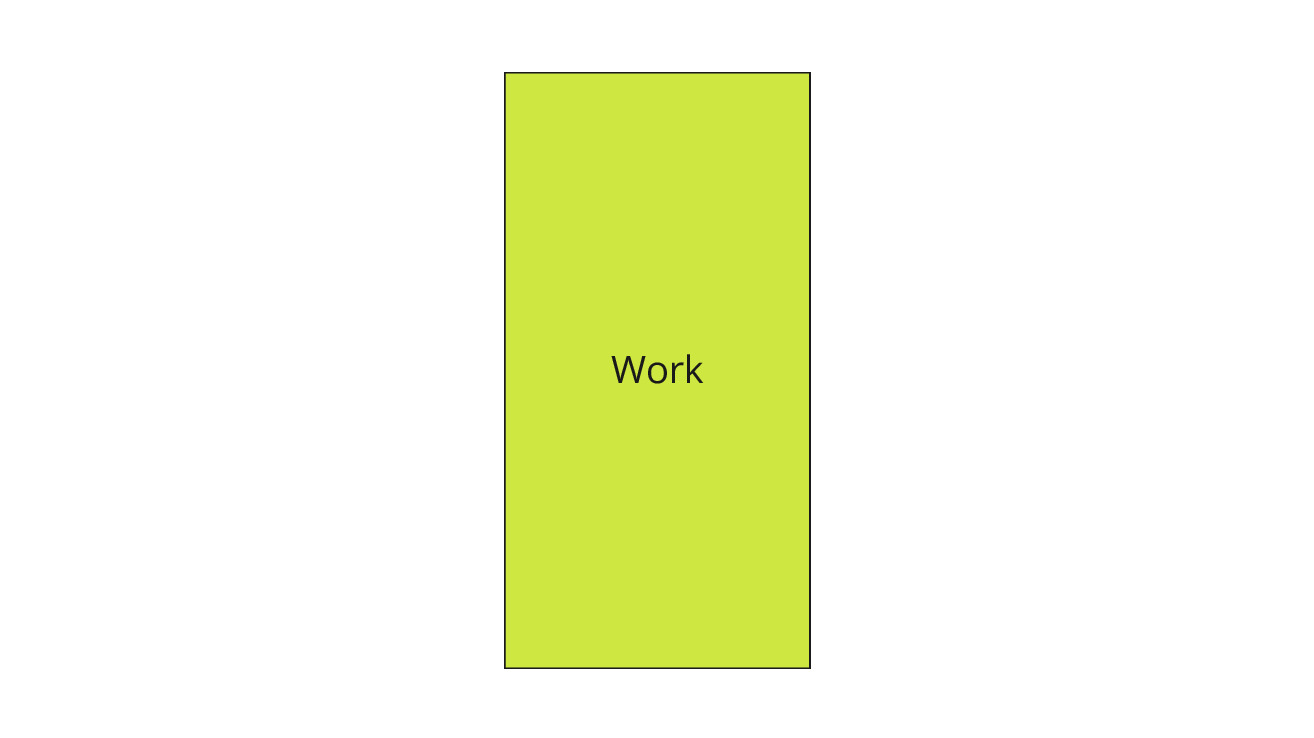
Let’s have a look at the different kind of work that a typical team from a big organization does. We represent this by drawing a bar, the height of the bar represents 100% of the work a team can do.
We see that many teams are spending 50% of their time on defects, leaving only 50% for work that adds value.
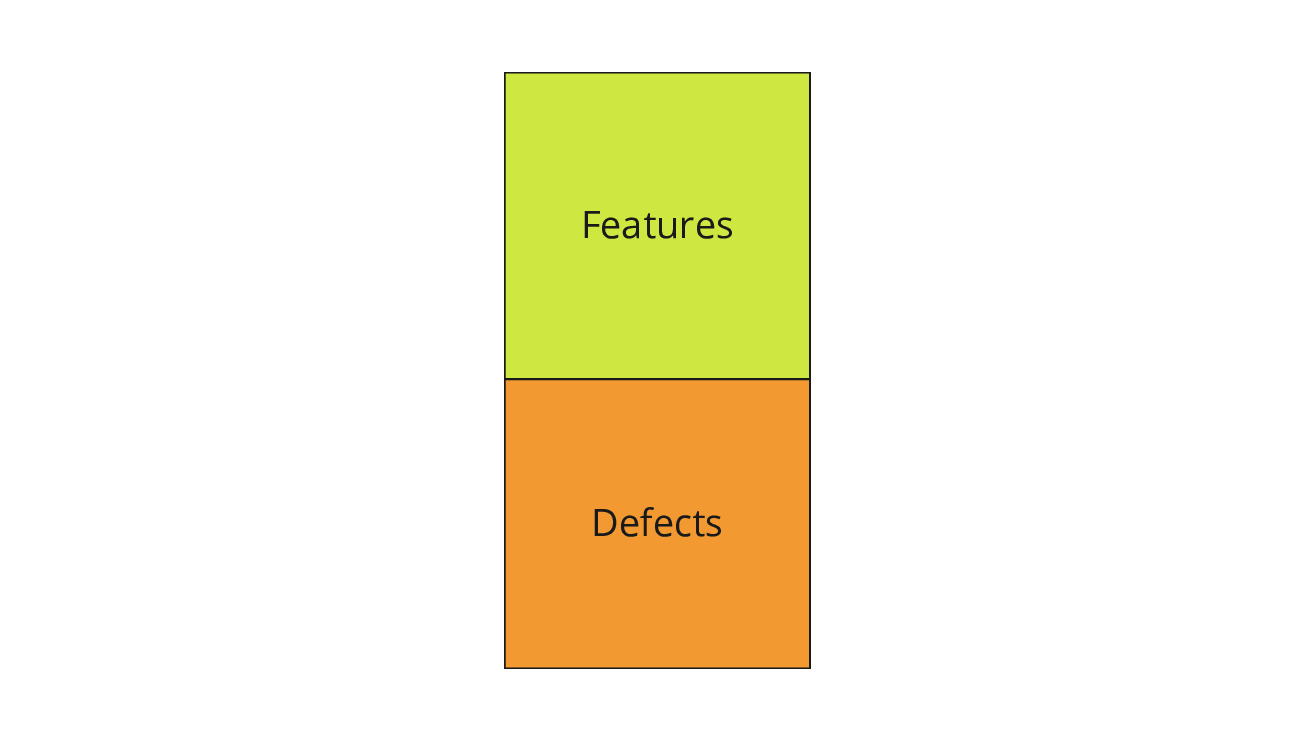
This kind of visualization of what share of their time a teams spends on is called a flow distribution, we learnt this from the book “Project to Product” by Mik Kersten. Visualizing the flow distribution of your work can give valuable and sometimes painful insights in what you spend your time on.
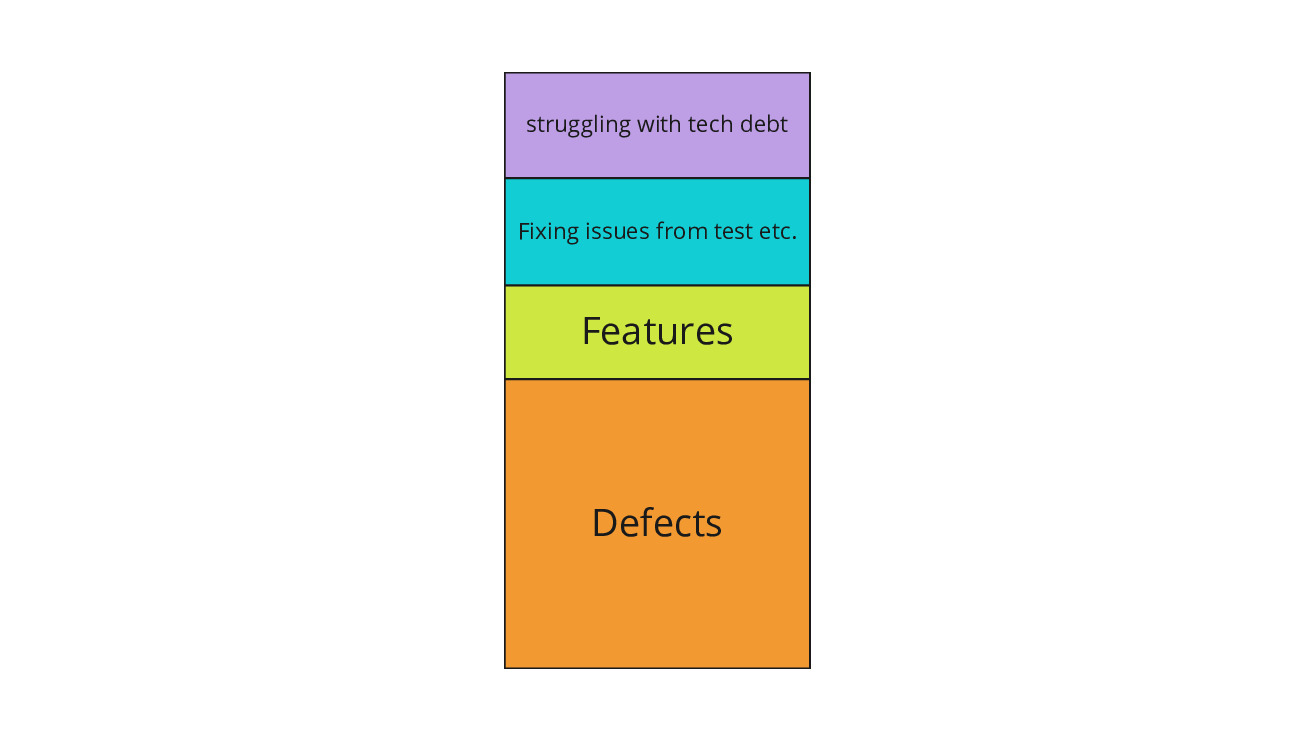
If we zoom in on the ‘feature work’, we see some interesting things. As these teams are struggling with a high volume of defect work, they “don’t have time” for improvements, e.g. keeping the code base in good shape. So technical debt accumulates and puts a tax on all the work. Everything is just harder to understand, harder to change.
Furthermore, there are even more defects than the team initially thinks there are. In our Agile Fluency® workshops, we always ask about the testing process before things are delivered to production. Often, there is late testing or a separate testing group that tests bigger batches at the end of development.
Because these defects do not escape to production or to customers, the team tends to think it is not that bad, or sometimes they think this is normal in software development. On top of that we have only mentioned the time software developers spend on defects, we have not even started to count the number of testers or customer support people needed to get the system in a good state for customers.
These activities surface defects, that are fed back to the developers. The longer this feedback loop, the more effort it takes to understand and fix these defects. This is a more than linear effect: defects that are found later have a much larger impact. So this eats away a significant share of the ‘feature’ time.
The net time spent on delivering value is even smaller than you’d initially expect. No wonder that people think the team is slow and management puts a lot of pressure on them. Even though the pressure actually has the opposite effect of what management intends to achieve.
You can always make time for improvements, but start small
Eventually, the team should work on reducing defects and technical debt, as this will make them much more productive. But this is a long term effect that requires investment. Claiming time for such an investment is a hard sell, as it has no short term benefits…or has it?
The leverage point here is to do small improvements that will help reducing the development cycle feedback loops. Getting better feedback on development work earlier will provide gains on the short term.
The challenge is to start out with tiny improvement efforts. This might be for instance pair programming, or doing a walkthrough of the code together when a developer has finished something, instead of waiting for pull request feedback.
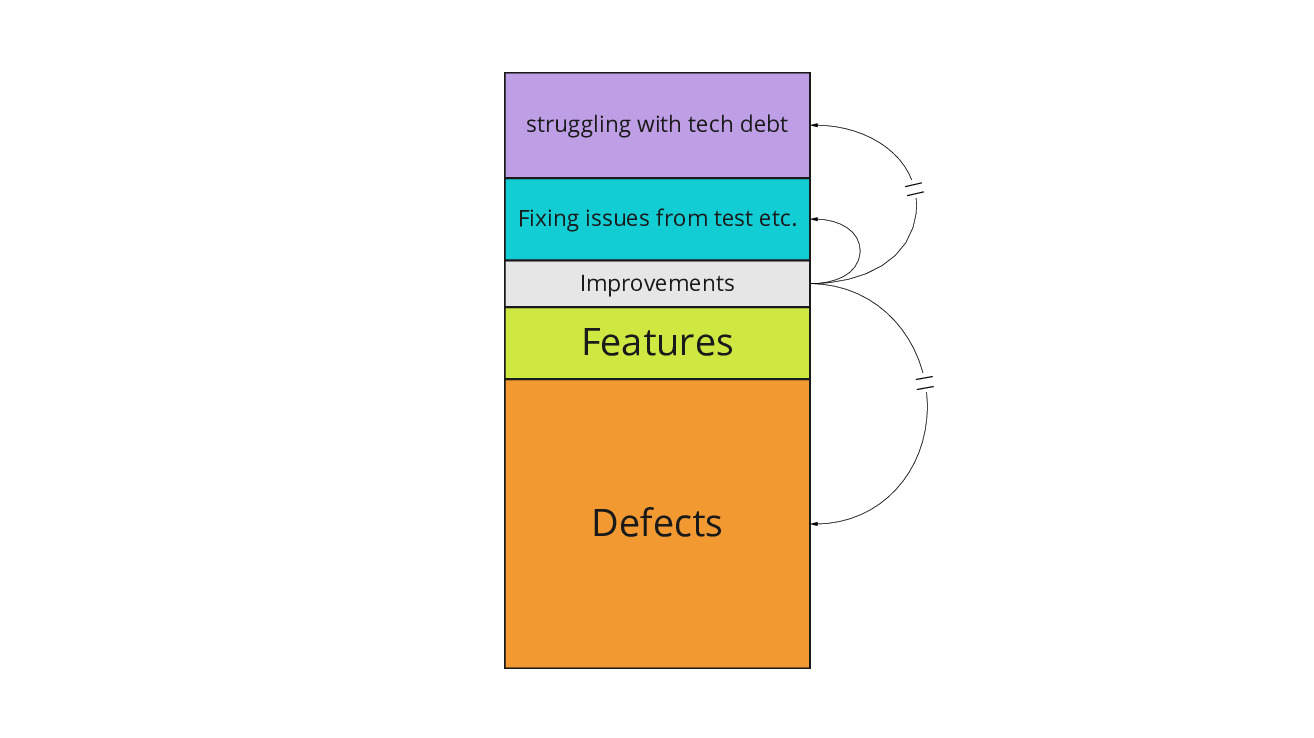
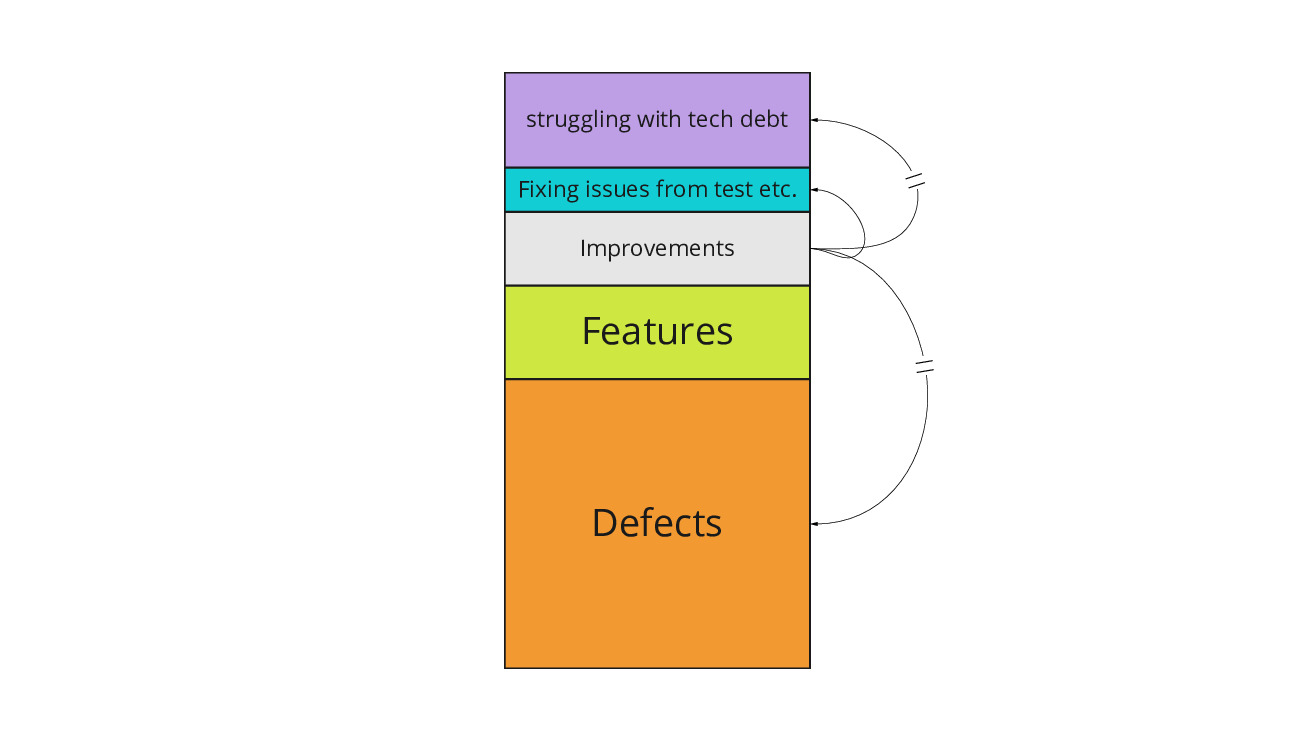
These tiny improvements start paying back pretty soon, in less things coming back from test, as indicated by the arrows. They also have longer term impact by reducing technical debt and reducing defects from production, as indicated by the || delay symbol on the arrows.
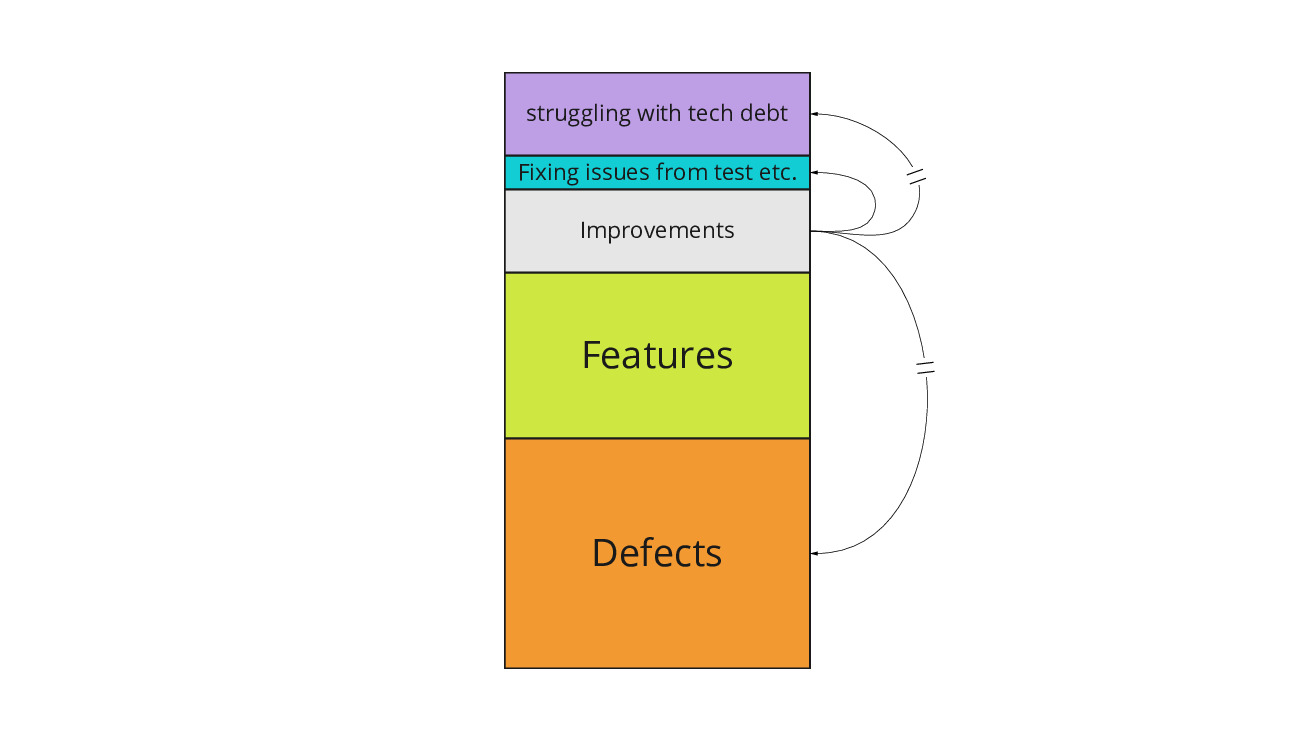
Once the improvements start paying off, the team is getting a bit more time available. Re-investing this time in more improvements will have the biggest long term payoff, but it can also be useful to spend a bit of the gains on extra feature work, to increase visibility and build a bit of goodwill.
Eventually, the number of defects will start going down. The vicious circle has been turned into a virtuous one.
As Abraham Lincoln once said:
“If I only had an hour to chop down a tree, I would spend the first 45 minutes sharpening my axe.” – Abraham Lincoln
Improvements may pay off sooner than you or I believe. We’ve often seen and experienced it, and as often need to remind ourselves and our clients about this.
References
- Mik Kersten, Project to Product (2018)
- Mike Hill wrote a series of posts about the value of taking baby steps: Many More Much Smaller Steps
Credits: Thanks to Lilian Nijboer for giving the nod of approval, and Rob Westgeest for making the Miro causal loop diagram less square.